
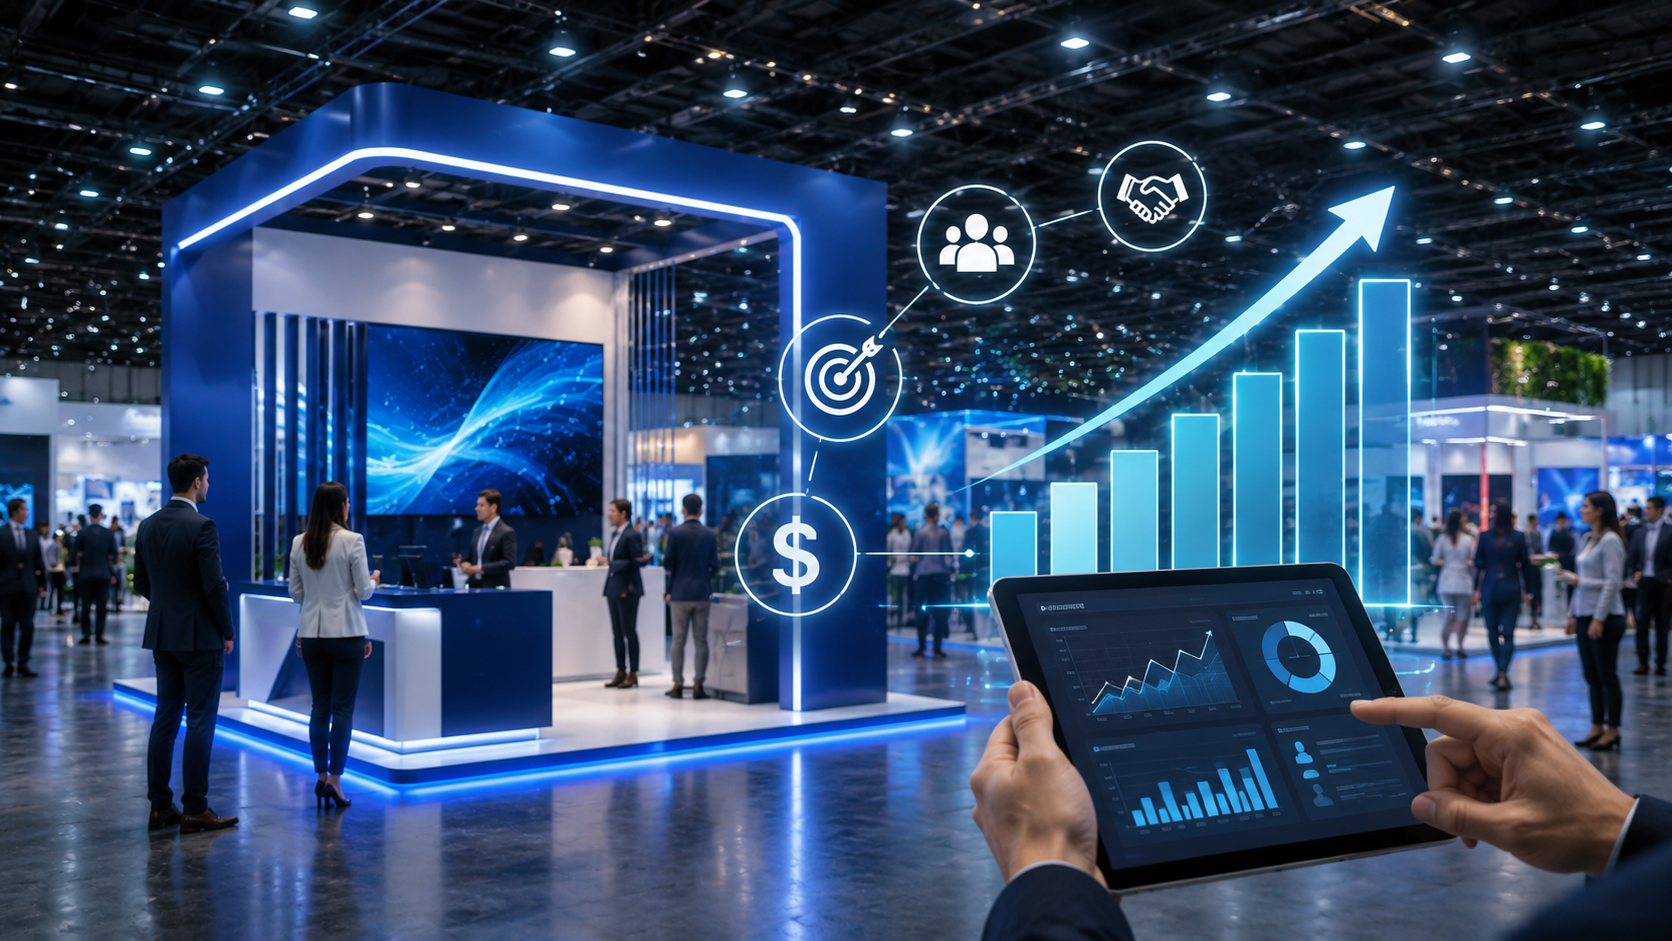
Why Measuring Signage ROI Is Key at Trade Shows
In many companies, booth signage is still viewed as a purely visual or decorative element. However, at professional trade shows and conferences, signage plays a much more strategic role: capturing attention, supporting understanding, and increasing commercial interaction.
That is why measuring the ROI of trade show signage is essential to understand whether the investment truly contributes to business generation. An effective graphic system can increase traffic, improve lead quality, and strengthen brand positioning. A poorly planned system can make even a large booth go unnoticed.
Within the ROI and Performance cluster, this article develops a complete framework for analyzing how to evaluate the real return on signage investment and how to optimize it for future events.
Operational Definition: What ROI Means in Event Signage
ROI of trade show signage (definition): the relationship between the investment made in the booth’s graphic and visual elements and the results obtained in terms of attention, interaction, leads, and business opportunities.
Basic ROI formula:
ROI = (return generated – investment made) / investment made
At trade shows, the calculation is not always immediate because many outcomes are indirect or delayed. That is why it is important to measure intermediate indicators—not only final sales.
The Performance Framework: How Signage Influences Results
Signage affects booth performance through four main functions:
- Visibility: ability to attract visitors.
- Understanding: clarity of the message.
- Interaction: ease of starting conversations.
- Conversion: impact on leads and opportunities.
This same pattern appears across every level of the booth: façade, wayfinding, dimensional signs, messaging, and product zones.
Visibility: The First Indicator of Graphic ROI
The first function of signage is to make the booth visible within the exhibition hall. Without attention, there is no interaction.
Indicators for Measuring Visibility
- Traffic toward the booth.
- Number of people who stop.
- Initial observation time.
These data points can be collected through:
- Direct observation.
- Traffic sensors.
- People-counting cameras.
- Manual analysis by the sales team.
If traffic is low despite a good location, there is usually a problem with visual impact or messaging.
Understanding: How to Measure Whether Visitors Understand the Message
Signage should not only attract. It must also quickly explain what the company does.
Signs of Strong Understanding
- Visitors quickly identify the product or service.
- Initial questions are more specific and relevant.
- The sales team spends less time explaining basic concepts.
How to Evaluate It
- Quick surveys.
- Sales team feedback.
- Analysis of repetitive conversations.
Effective signage reduces communication friction.
Interaction: The Indicator Most Closely Related to Signage
Interaction is one of the most important indicators because it connects attention with business opportunity.
What to Measure
- Number of conversations started.
- Booth entry rate.
- Participation in demos or activities.
Strong signage facilitates interaction because it:
- Reduces uncertainty.
- Makes the booth more accessible.
- Guides visitors toward key areas.
Conversion: How to Connect Signage and Leads
The most important ROI stage is conversion.
Key Indicators
- Leads captured.
- Meetings booked.
- Quote requests.
- Post-show sales.
Signage influences this stage because it shapes:
- The quality of traffic.
- The clarity of the message.
- The perception of professionalism.
A visually confusing booth often attracts less-qualified visitors.
How to Calculate the Real Cost of Signage
To measure ROI correctly, you first need to calculate the total investment.
Common Signage Costs
- Graphic design.
- Production and printing.
- Dimensional signs.
- Integrated lighting.
- Installation and dismantling.
- Shipping and storage.
The most common mistake is considering only the printing cost.
Key Indicators for Measuring Trade Show Signage ROI
1) Cost per Lead
Formula:
Total signage cost / number of leads generated
This makes it possible to compare efficiency across different events.
2) Capture Rate
Formula:
Visitors who enter / traffic in front of the booth
Measures the ability to attract visitors.
3) Commercial Conversion Rate
Formula:
Qualified leads / total interactions
Indicates the quality of visual communication.
4) Average Dwell Time
The longer visitors stay, the stronger the interest generated usually is.
Comparison: Effective Signage vs. Inefficient Signage
- Clear message vs. confusing message
- High interaction vs. low interaction
- Qualified leads vs. irrelevant traffic
- Hierarchical design vs. visual overload
- Smooth experience vs. chaotic flow
How to Improve Signage ROI at Events
1) Simplify the Main Message
Visitors should understand the value proposition in just a few seconds.
2) Improve Visibility
Dimensional signs, lighting, and contrast increase attention.
3) Design Clear Visitor Flows
Wayfinding should make movement and interaction easier.
4) Integrate Calls to Action
Visitors should know what to do next: demo, meeting, or contact.
5) Reuse and Optimize
Modularity improves profitability over the medium term.
Practical Checklist for Evaluating Signage ROI
- Did traffic toward the booth increase?
- Did visitors quickly understand the offer?
- Did conversations increase?
- Did lead quality improve?
- Was the investment reusable?
Common Mistakes When Measuring Signage ROI
- Measuring only final sales.
- Not analyzing traffic and interaction.
- Ignoring brand perception.
- Not comparing events with each other.
Real performance is usually built through a combination of multiple indicators.
How Full-Expo Can Help You Improve Your Booth’s Visual ROI
Full-Expo develops signage solutions focused on commercial performance, integrating:
- Strategic graphic design.
- High-visibility dimensional signs.
- Functional wayfinding.
- Technology and modular integration.
The goal is not only to create an attractive booth, but to maximize interaction, understanding, and conversion.
Correctly designed signage improves both the visitor experience and the return on investment from the event.
Conclusion: Measuring ROI Turns Design into Performance
The ROI of trade show signage should not be analyzed only from the perspective of graphic cost. It should be evaluated as a system that influences attention, interaction, and business opportunity generation.
Companies that measure these indicators can optimize every event, reduce waste, and progressively improve their trade show presence.
At increasingly competitive international trade shows, signage is no longer a decorative element. It becomes a strategic asset capable of increasing real results.
Working with specialists like Full-Expo makes it possible to develop visual systems designed not only to stand out, but to sell better.
Frequently Asked Questions About Trade Show Signage ROI (FAQs)
It is the relationship between the investment made in booth graphics and the results obtained in traffic, leads, and opportunities.
By analyzing traffic, interaction, message understanding, and lead generation.
Cost per lead, booth entry rate, dwell time, and conversion rate.
Yes, because it affects visibility, brand perception, and the quality of sales conversations.
With clear messages, hierarchical design, and a visitor-oriented visual experience.
Too much information, poor wayfinding, and no calls to action.
Because it allows you to optimize future investments and increase the booth’s commercial performance.