
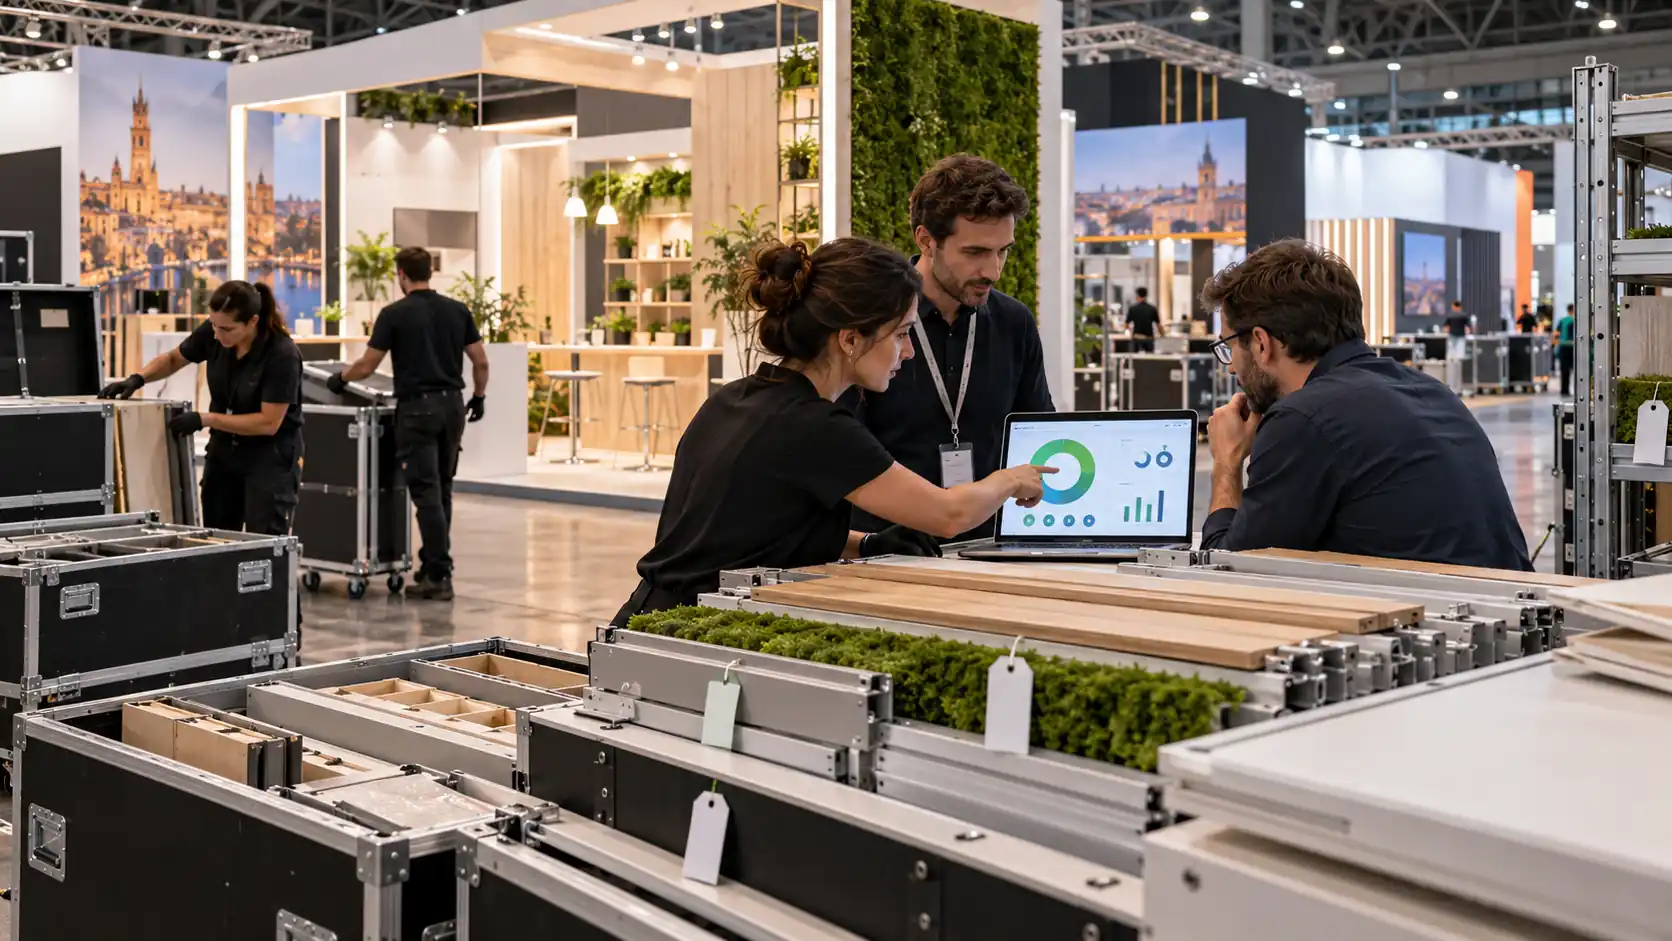
What to measure to determine whether a booth is truly being reused
A booth can be designed for multiple events and still require new components, graphics, repairs, and transportation for every installation. That is why calling a project reusable provides little meaningful information without supporting data.
Trade show booth reuse: the repeated use of one or more exhibit components while preserving their primary function across different installations.
Measuring reuse requires tracking which elements remain in service, which are adapted, which are replaced, and which reach the end of their useful life.
For an agency managing a trade show tour across Spain, the unit of analysis should remain consistent. Madrid, Barcelona, Valencia, or Bilbao should all be measured using the same definitions and criteria.
Reuse KPI: a quantifiable indicator used to compare the retention, replacement, efficiency, or cost of an exhibit system across different events.
KPIs can be divided into four categories: materials, operations, logistics, and economics.
- Materials: modules, graphics, replacements, and waste.
- Operations: installation hours and incidents.
- Logistics: weight, transportation, and storage.
- Economics: cost per event and cumulative cost per use.
These dimensions are related, but they are not equivalent. A higher reuse rate may reduce new purchases while increasing repair or transportation requirements.
For that reason, a sustainable trade show booth in Spain should not be evaluated using a single percentage.
ISO 20121:2024 addresses event sustainability through a management system that considers environmental, economic, and social dimensions. It does not prescribe a specific material or, by itself, certify that a reusable booth has a lower impact.
Communication also requires precision. Directive (EU) 2024/825 strengthens rules concerning certain generic environmental claims and requires Member States to apply its provisions starting September 27, 2026.
This reinforces a useful practice for agencies: communicate what has actually been measured and avoid automatically extrapolating the result.
It is more verifiable to say “78% of the modules were reused” than to simply claim “the booth is eco-friendly”.
Baseline: a reference scenario used to compare actual results and calculate a variation.
A baseline is essential when communicating reductions. Without a comparable reference, the actual result can be measured, but a reduction attributable to the system cannot be established.
KPIs for measuring booth reuse throughout the entire trade show tour
1. Percentage of reused modules.
This is the primary physical indicator. It measures the proportion of modules installed at a trade show that have been used previously.
Formula: reused modules / total modules installed × 100.
If 50 modules are installed and 40 have already been used, the reuse rate by unit is 80%.
This calculation works well when the modules are comparable. If there are significant differences in size or weight, other units should also be added.
- Units: number of reused components.
- Weight: kilograms of reused material.
- Surface area: m² of panels, flooring, or enclosures retained.
- Cycles: cumulative number of events per component.
The number of cycles adds a time dimension. A component that has been used at seven trade shows has a different history from one that has just been used for the second time.
2. Replacement rate.
This KPI shows how much inventory stops being reused between two events because of damage, obsolescence, loss, or design changes.
Formula: replaced components / components available before the event × 100.
A high reuse rate combined with an increasing replacement rate may indicate that the system is approaching the end of its useful life or requires more maintenance.
3. Square meters of new and reused graphics.
Visual communication often changes more frequently than the structure. For that reason, graphics should have their own dedicated metrics.
Percentage of reused graphics: m² of reused graphics / total m² installed × 100.
The surface area of newly produced graphics should also be recorded for each event.
A booth may reuse 90% of its structure while replacing 100% of its graphics. Both figures should be reported separately.
This separation prevents a high structural reuse rate from concealing significant material replacement in other parts of the project.
4. Waste generated.
The most robust indicator is the actual weight of waste generated per trade show and, when practical, its classification by material.
- Wood and wood-based panels.
- Metals.
- Textiles.
- Vinyl and graphic substrates.
- Plastics.
- Packaging.
A waste intensity metric can also be calculated to compare booths of different sizes.
Waste intensity: kg of waste generated / m² of booth space.
This normalization avoids directly comparing a 30 m² booth with a 150 m² booth.
5. Potentially avoided waste.
This indicator requires greater caution because it relies on a hypothetical scenario.
Potential waste avoided: the difference between the waste generated by a comparable baseline and the waste actually recorded.
If a documented reference scenario would generate 450 kg and the actual installation generates 170 kg, the estimated difference would be 280 kg.
The baseline must always be clearly explained. Without it, it is not rigorous to claim that a specific amount of waste has been avoided.
6. Person-hours for installation and dismantling.
Reuse can simplify repetitive operations, but it can also introduce repairs and adaptations. Tracking working hours shows what actually happens.
The hours worked by everyone involved should be added together. Six installers working eight hours represent 48 person-hours.
A normalized metric can be used to compare booth sizes.
Installation intensity: installation person-hours / m² installed.
If this intensity decreases over the course of the tour, it may indicate an operational improvement. If it increases, adaptations, incidents, or additional complexity should be analyzed.
7. Production, transportation, and installation incidents.
A reusable system must also remain reliable. Tracking the number of incidents helps identify deterioration or adaptation problems.
- Production: component, dimensional, or finish errors.
- Transportation: losses or damage.
- Adaptation: incompatibilities with the booth space.
- Installation: assembly difficulties.
- Graphics: incorrect dimensions or materials.
- Technical systems: electrical, lighting, or audiovisual problems.
The absolute number should be supplemented with severity. A minor vinyl replacement is not equivalent to a structural modification that puts the handover schedule at risk.
An incident rate per 100 person-hours can also be calculated to compare installations of different durations.
8. Logistics indicators.
A high reuse rate should not be analyzed without considering transportation. Moving heavy materials over long distances can change both the environmental and economic assessment of the project.
Useful metrics include kilometers traveled, transported weight, number of vehicles, occupied volume, and required storage.
These indicators do not calculate a carbon footprint on their own. Converting logistics activity into CO2e requires a defined methodology and appropriate emission factors.
For that reason, a reuse percentage should not be converted directly into an emissions-reduction percentage.
9. Cost per trade show.
Reuse should also be evaluated economically throughout the full tour.
The calculation should include the initial fabrication cost and comparable recurring costs: adaptation, repairs, graphics, transportation, storage, installation, and dismantling.
Average cost per trade show: cumulative system cost / number of events completed.
If the cumulative cost after five events is €70,000, the average is €14,000 per trade show.
This figure should be compared with alternatives that include the same scope. Comparing one amount that includes transportation with another that excludes logistics would produce a misleading conclusion.
10. Cost per component use.
Cost per use: cumulative cost attributable to a component divided by the number of installations in which it has been used.
This metric helps determine when to retain, repair, or replace structures, lighting, furniture, and other components.
It can also identify expensive components that appear reusable but generate high maintenance costs between events.
How to build a comparable KPI dashboard.
All of these indicators require a consistent data source. Tracking should begin with an identifiable inventory before the first trade show.
- Module inventory and number of cycles.
- m² of new and reused graphics.
- Repaired and replaced components.
- Kg of waste by category.
- Installation and dismantling person-hours.
- Incidents and severity level.
- Kilometers, loads, and transported weight.
- Fabrication, adaptation, logistics, and installation costs.
Madrid and Barcelona should use the same units and definitions. Changing the methodology during the tour prevents accurate comparison of results.
Supporting evidence should also be retained: photographs, inventories, installation reports, print orders, waste documentation, delivery notes, and invoices.
Data quality: the degree to which an indicator can be reconstructed using consistent, traceable, and comparable information.
A highly precise KPI without a documented source is less useful than a simple measurement supported by verifiable records.
How to communicate the data without greenwashing.
Communication should respect the scope of each metric. A physical KPI should not automatically be converted into an environmental conclusion.
If 75% of the modules are reused, that is the claim that can be substantiated. To claim a reduction in waste, a specific waste comparison must exist.
To claim an emissions reduction, an emissions-calculation methodology covering the relevant sources would be required.
Directive (EU) 2024/825 defines and restricts certain generic environmental claims. National provisions implementing it must apply from September 27, 2026.
For an agency, the practical rule is simple: state exactly what the data shows and explain the reference used whenever a reduction is communicated.
A strong example would be: “82% of structural modules reused compared with the previous installation, with 24 m² of new graphics produced for this edition”.
This is much more precise than claiming that the booth is “82% more sustainable”, because that statement assigns an environmental meaning that the data does not demonstrate.
How Full-Expo can support a trade show tour.
Full-Expo currently offers modular systems designed for reuse, including aluminum structures and large-format fabric graphic solutions.
It also works exclusively with agencies and B2B professionals and has its own production, assembly, painting, logistics, and storage areas.
These capabilities can help support inventory control between trade shows: which components return to storage, which are repaired, which are adapted, and which are shipped again to the next event.
Storage also makes it possible to track the actual number of use cycles for structures, furniture, lighting, and other elements.
The goal should not be to automatically label the project as sustainable. The real value lies in having data that makes it possible to evaluate how the system performs throughout the tour.
The final framework returns to the same principles: measure, compare, document, and interpret.
Measurement shows what happened. Comparison shows how it changed relative to a reference. Documentation provides evidence. Interpretation prevents a partial indicator from being turned into a conclusion that cannot be supported.
In this way, answering how to measure trade show booth reuse across a Spanish trade show tour using KPIs for agencies becomes less a matter of perception and more a verifiable methodology.
Frequently asked questions about trade show booth reuse KPIs (FAQs)
Divide the number of reused modules by the total number of modules installed and multiply by 100. It can also be calculated by weight or surface area.
Useful metrics include reused modules, new graphics, replacements, waste, person-hours, incidents, transportation, cost per event, and cumulative number of uses.
A comparable baseline is required. The difference between reference waste and actual waste can be used to estimate potentially avoided waste.
Total person-hours can be used and normalized by surface area by dividing installation person-hours by the number of square meters installed.
No. Reuse is a material-use indicator. Environmental impacts also require consideration of transportation, waste, repairs, energy, and other relevant factors.
Use specific data, state the reference used, and avoid turning reuse percentages into environmental claims that have not actually been calculated.